Samuel
Adanu
Data Manipulation • Data Visualization Design • Data Storytelling • Business Process Optimization
I transform complex data into strategic business insights. I build powerful dashboards using Power BI and Excel — and I train individuals and teams to do the same. Let's turn your data into your competitive advantage.

About Me
Transforming public sector revenue and expenditure data into actionable fiscal insights
I am Samuel Adanu, a Data & Business Analyst based in Accra, Ghana, with 8+ years of experience in data analysis, revenue management, and business operations. I transform complex data into strategic business insights that drive efficiency, revenue growth, and informed decision-making.
My core skills span Data Manipulation, Critical Thinking, Data Visualization Design, Data Storytelling, Dashboard Development, Data Management and Business Process Optimization. My primary tools are Microsoft Excel (with Power Query) and Power BI Desktop.
I bring a unique edge: my background as a Tax Compliance Officer at the Ghana Revenue Authority (GRA) gives me a deep understanding of complex financial data and regulatory requirements. I develop analytical solutions that solve real business challenges and deliver measurable impact — I don't just move data; I provide answers.
Beyond building dashboards, I now offer Data Analytics Training and Coaching for individuals and teams who want to develop practical skills in Power BI and Excel. Whether you are starting from scratch or looking to level up, I provide hands-on, goal-oriented sessions tailored to your pace and objectives.
Available for freelance engagements on Upwork and directly. Whether you need insightful dashboards, data training, process optimization, or financial analysis — let's turn your data into your competitive advantage.
Experience & Education
Data Analytics & Visualization Expert
Upwork • Accra, Ghana
Tax Compliance Officer
Ghana Revenue Authority • Accra
Assistant Rating Officer
Accra Metropolitan Assembly (AMA) • Accra
General Manager
J-Elyon Internet Café • Accra
BSc. Accounting
GIMPA — Ghana Institute of Management and Public Administration
Graduate Diploma, Management Studies
Institute of Commercial Management (ICM) — England
Diploma in Business Studies
Institute of Commercial Management (ICM) — England
Certifications
Learning Power BI Desktop
LinkedIn Learning
Using Power BI with Excel
LinkedIn Learning
Data Career Roadmap
Maven Analytics
Generative AI Essentials
Maven Analytics
Power BI Essential Training (2024)
LinkedIn Learning
Excel and ChatGPT: Data Analysis Power Tips
LinkedIn Learning
Services
From building powerful dashboards to coaching the next generation of data analysts — here is how I can help you or your team.
Data Analytics & Reporting
End-to-end data analysis for businesses, government agencies, and NGOs. I clean, model, and analyze your raw data to produce clear, actionable reports and insights.
- Data cleaning and transformation with Power Query
- Revenue and financial performance analysis
- Tax compliance and regulatory reporting
- KPI definition and metrics framework design
- Business process analysis and optimization
Dashboard Development
Custom interactive dashboards in Power BI and Excel that transform raw data into clear visual stories. Built for decision-makers who need real-time, reliable insight at a glance.
- Power BI Desktop dashboard design and build
- Advanced Excel dashboard development
- Star-schema data modeling for performance
- DAX measures and calculated columns
- Interactive navigation and drill-through reports
Data Analytics Training & Coaching
Hands-on, practical training sessions for individuals and teams who want to build real-world skills in Power BI and Excel. Learn at your own pace with a mentor who uses these tools daily.
- Introduction to Power BI Desktop for beginners
- Data types, data cleaning and transformation basics
- Building your first interactive dashboard
- Advanced Excel for data analysis and reporting
- One-on-one coaching and group sessions available
Featured Projects
A collection of data analytics and visualization work — from Tax Revenue Intelligence to Personal Finance Tracking and my latest project: A Power BI Audit of Operations & Transaction Efficiency at Maven Roasters 3 NYC Coffee Shops. View my full portfolio on Maven Showcase.
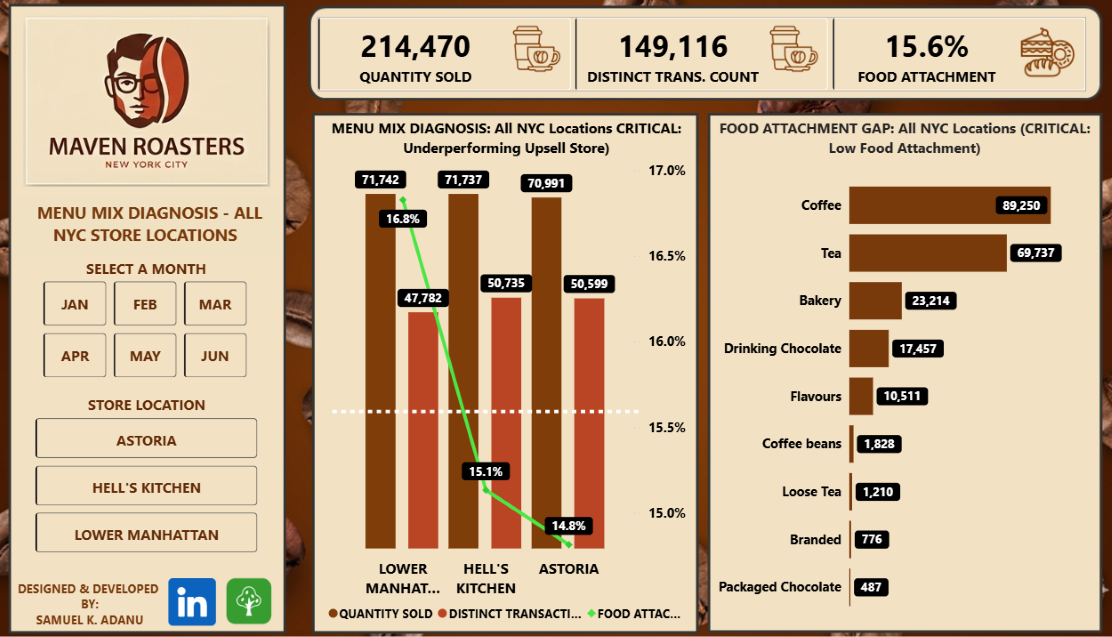
Operational Optimization & Transaction Efficiency: A Power BI Audit of Maven Roasters 3 NYC Coffee Shops
Latest ProjectI evolved Maven Roasters' sales reporting from a static Excel model into a Power BI Operational Suite — shifting focus from revenue tracking to a diagnostic audit of transaction efficiency across three NYC Store locations.
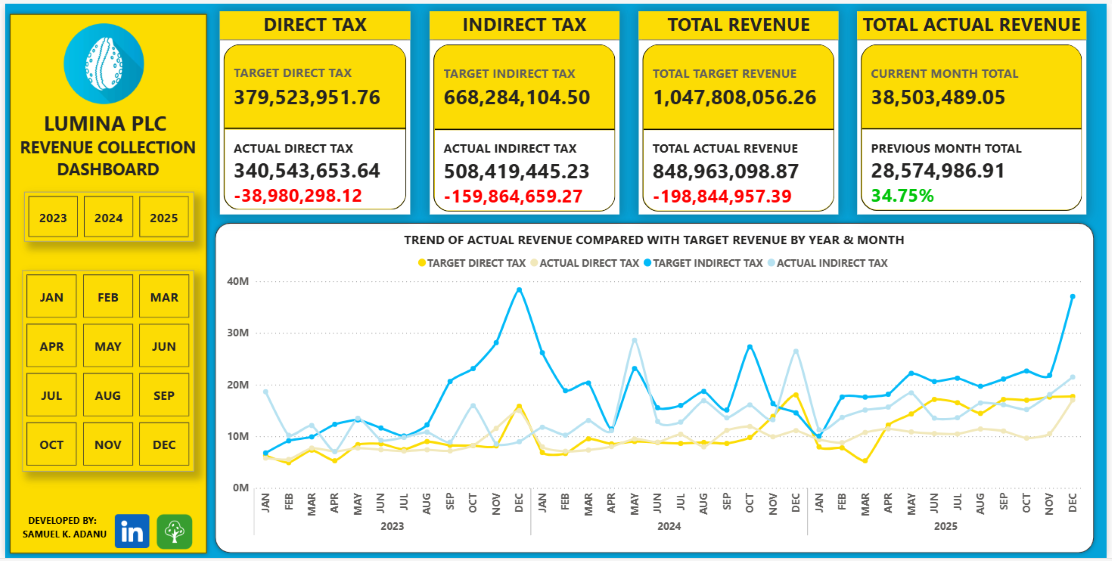
Power BI Revenue Performance Analysis Dashboard: Enhancing Efficiency in Tax Revenue Collection Domain Expertise
A comprehensive Power BI dashboard tracking tax revenue performance (2023–2025 YTD) for the Ghana Revenue Authority. Features KPI Cards & Line Charts comparing Target Revenue with Actual Revenue, Stacked Bar Charts depicting Revenue by Tax Category, a Daily & Weekly Revenue Trends, Top 500 Taxpayers Dashboard and a fully interactive navigation bar. The project was built on a star-schema data model with Power Query transformations.
Personal Finance Tracker
An interactive Excel dashboard for tracking personal income and expenditure over time. Features KPIs including Total Income, Total Expenditure, and current vs. prior period comparisons — with custom charts for month-by-month financial trends.
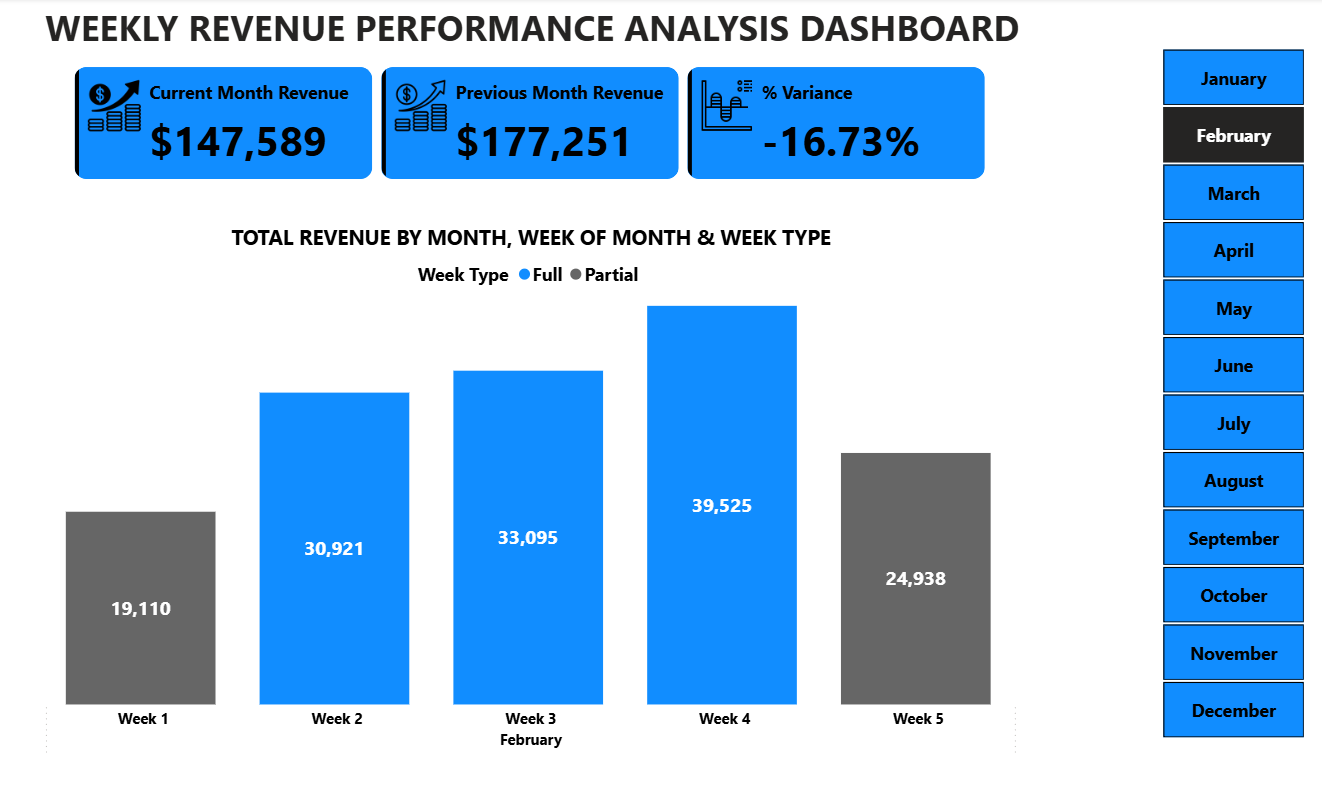
Weekly Revenue Performance Analysis Dashboard
A Power BI Desktop dashboard built to gain clear visibility into weekly revenue performance trends. It compares month-over-month revenue changes and highlights underperforming periods — giving business decision-makers the real-time intelligence they need to act fast.
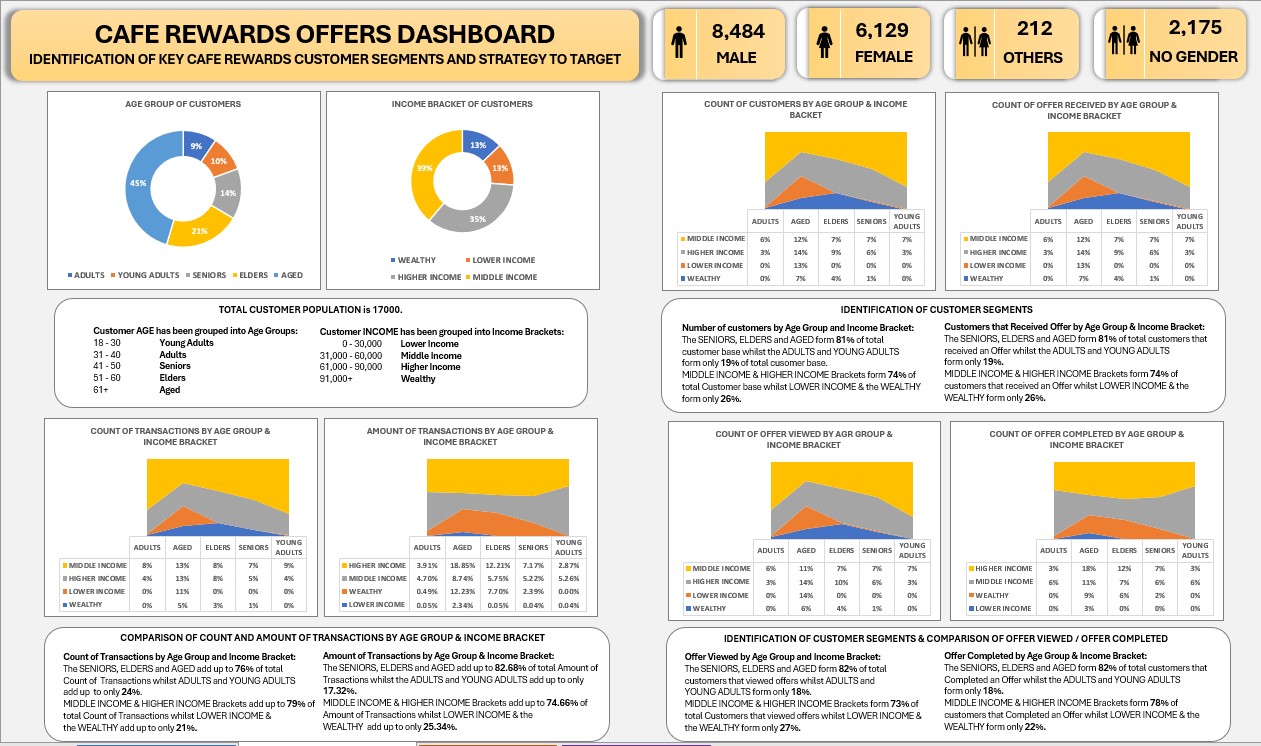
Cafe Rewards Offers: Customer Segmentation & Promotional Strategy
An interactive Microsoft Excel Dashboard built to identify high-value customer segments and develop a data-driven targeting strategy that would inform future promotional campaigns and optimize marketing ROI.
Skills & Tools
Core competencies built through hands-on projects, formal training, and applied work at the Ghana Revenue Authority.
Data & Analytics Tools
Core Professional Skills
Contact Me
Available for freelance analytics projects, dashboard development, data training, coaching engagements, and consulting.
Let's Work Together
Whether you need a one-off dashboard, ongoing data analysis, or strategic insights for your organization — I'm here to help. Reach out and let's talk about your data challenge.